选择题
2011 AMC 8 Problem 11: Asha and Sasha Study Bars
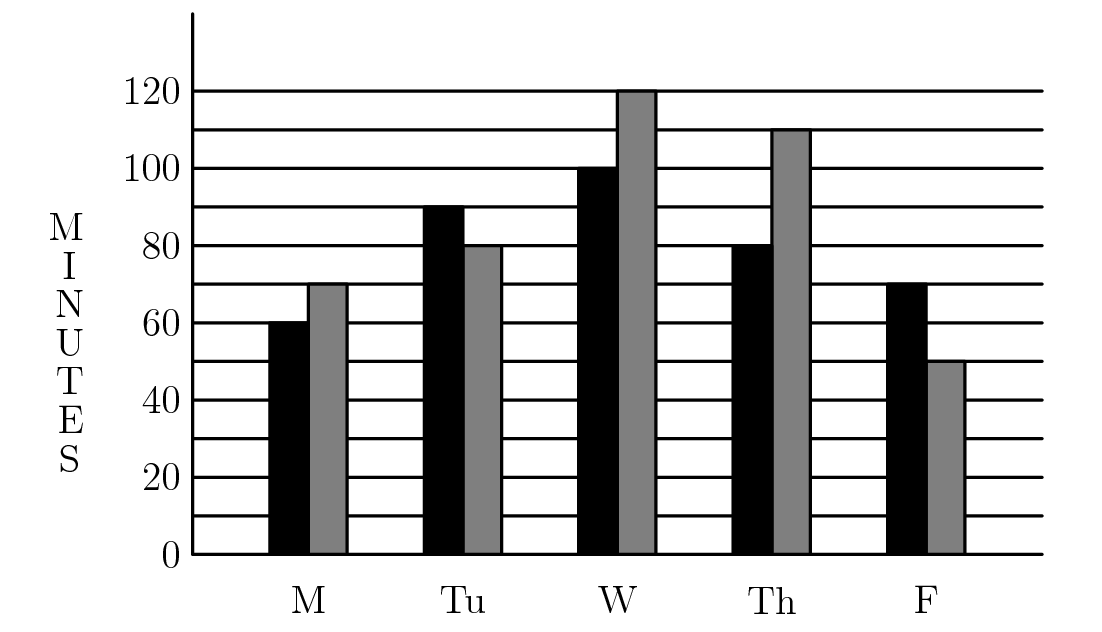
The graph shows the number of minutes studied by both Asha (black bar) and Sasha (grey bar) in one week. On the average, how many more minutes per day did Sasha study than Asha?
A.
6
B.
8
C.
9
D.
10
E.
12