选择题
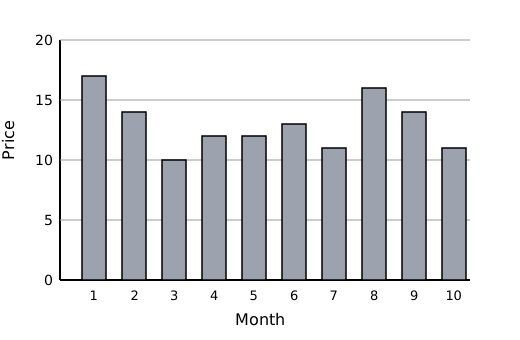
2010 AMC 8 Problem 3: Gasoline Bar Graph
The graph shows the price of five gallons of gasoline during the first ten months of the year. By what percent is the highest price more than the lowest price?
A.
50
B.
62
C.
70
D.
89
E.
100