选择题
2000 AMC 8 Problem 4: At-Home Work Graph
In 1960 only 5% of the working adults in Carlin City worked at home. By 1970 the at-home work force increased to 8%. In 1980 there were approximately 15% working at home, and in 1990 there were 30%. The graph that best illustrates this is
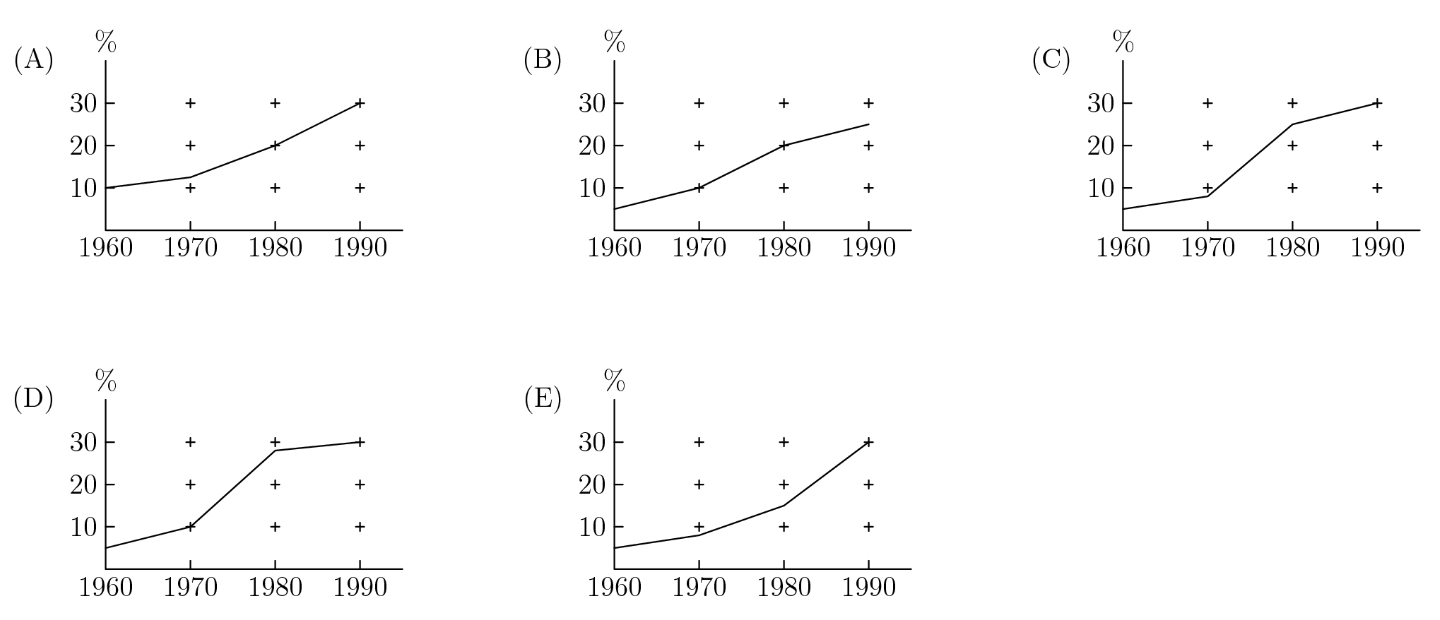
A.
Graph A
B.
Graph B
C.
Graph C
D.
Graph D
E.
Graph E